Time Series
Displays data based on the time period/series you are wanting to view.
Expanding the time series function then shows the different year periods. Any of these years will display the 12 months on which you can lock onto. For example:
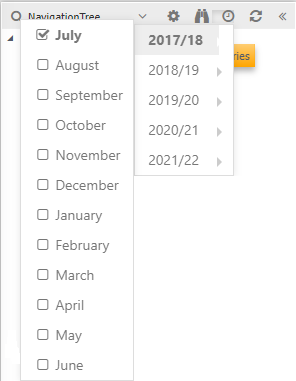
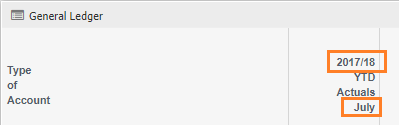
An indication of which period is currently locked is to check the headings of the fields in the data browser window. It will state the month as well as the year.
Time Series impacting fields
Time series does impact the fields that are available to you for example, choosing Mostly Used, might show the below
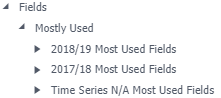
As the fields are driven off the time series chosen. It may only look like 3years of fields exist, however, the first being the current year, the 2nd being the previous year and the last (time series N/A most used fields) is the previous 2 years.
If you change the time series to 2021/22 the fields will now display as
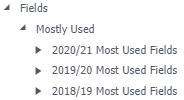
You are not limited to seeing 3 years worth of information. It just that you can see 3 lots of years fields depending on what the timeseries is set to.
Over time you will have a number of time series to choose from and the fields will change accordingly.
From Edit Mode
Changes the time series of all widgets in your Data Browser/dashboard.
This is useful to see multiple widgets all at one time series.