Edit Mode / Report Editor
This is only applicable for analytics such as documents, general ledger.
Provides a wide range of editing capabilities for the report based on the data browser, such as the title of the report, have a different font for different levels, the colour of the text, borders, logo etc.
As you can not see what the report looks like until you run it, the editing options you use will hold so you do not have to keep selecting the same options each time.
This may be useful for quick online reports that are not really to be used for publishing purposes, where excel reports would be more appealing.
These will be saved in the Reports function.
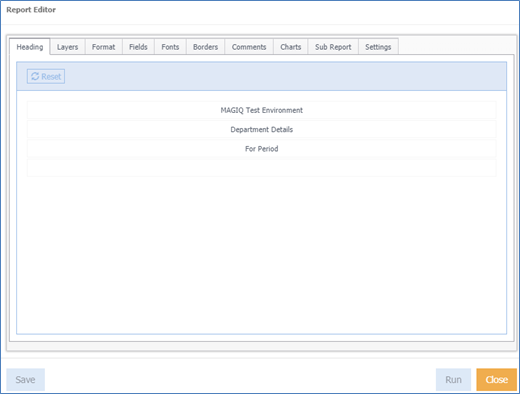
Heading
Heading is displayed based on the name of the Data Browser window or report being viewed. The heading can altered if necessary.
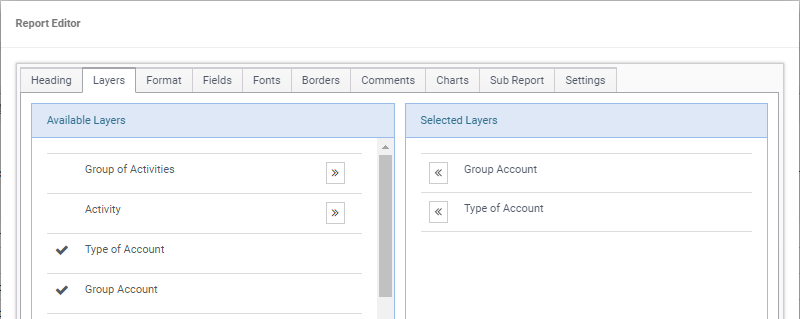
Layers
Add as many layers into your report by clicking  next to the layer name to send across to Selected Layers.
For example:
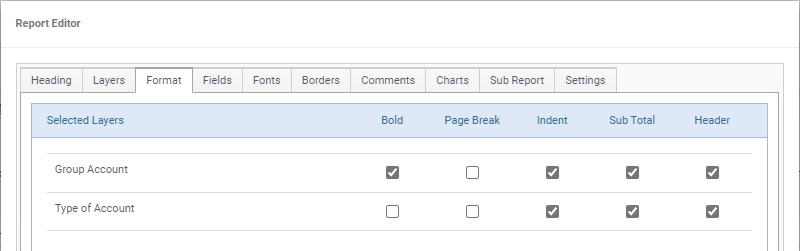
Format
Select how the layers will display such as bold, placing page breaks at a certain layer, indenting any layers, including a sub total or specifying it as a header.
For example:
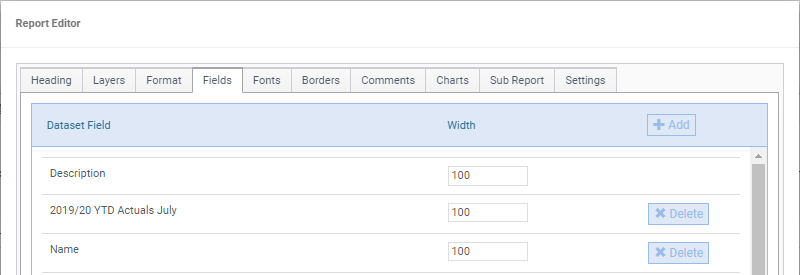
Fields
Display which fields you have displayed in your Data Browser window. Specify what width the field will be. Width is determined by pixels.
For example:
Additional fields can be added to the report by clicking  . The fields popup will display
to click and drag your fields across these fields will be added to the bottom of the list.
. The fields popup will display
to click and drag your fields across these fields will be added to the bottom of the list.
Fields can be deleted from the report by clicking 
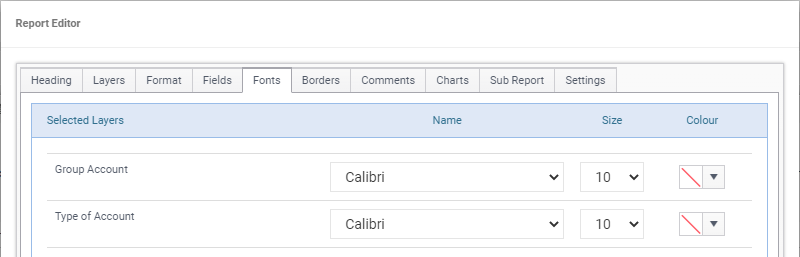
Fonts
Select the font style, size and colour for the layer headings.
For example:
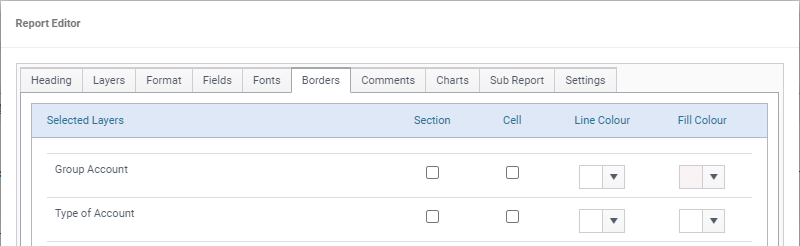
Borders
Select options whether the layer will have a border around the Section or cell, what colour the border will be and whether there will be a fill colour.
For example:
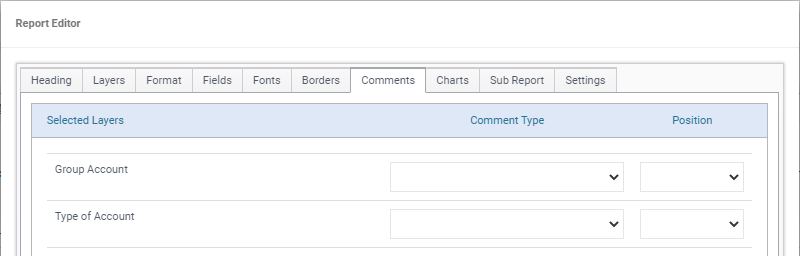
Comments
Select comments that are on the Data Browser window to appear on your report and choose whether the comment will display in the layer header or footer.
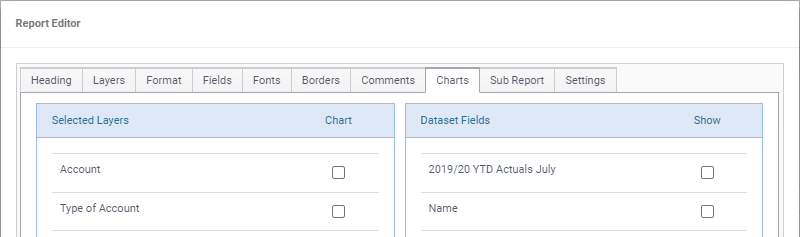
Charts
Display a chart at the end of your report.
Sub Report
If you are creating a planner report that displays KPI measure information and financials under the plan actions.
Settings
Configure how you want different aspects of the report to display.
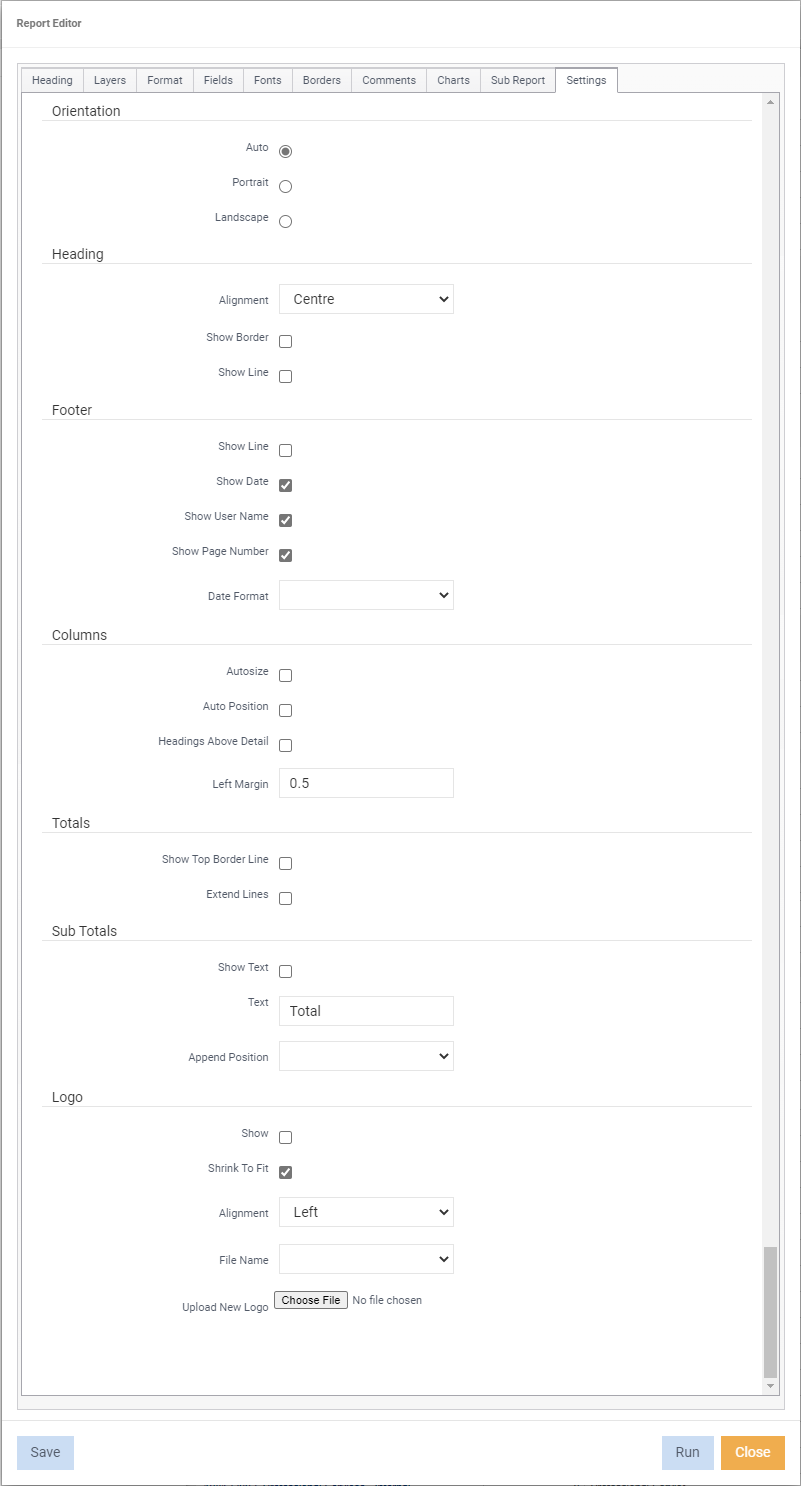
Orientation - Is the report to be viewed as Portrait or Landscape. If Auto is selected in the Page Orientation option, the report will be viewed based on the width of the report.
Heading - Configure how you want the report heading to display to a show border, report heading line and change the alignment of the report heading.
Footer - Configure how you want the report footer to display.
Date Format - What format the date will be displayed.
Columns - Choose whether the colimns will be auto sized, auto positioned, column headings above the details and the ability to set the left margin on your report.
Totals - Choose how the totals are to display, such as show top border line and extend lines.
Sub Totals - Configure how you want sub totals to display such as a customised description of the Sub Total Text. For example, Sub Total or simply Total.
Append Position - With Show Text ticked, select Start or End to have the text before or after the sub total.
Logo - Include your organisations logo, as well as control its alignment and shrinking it to fit on the report.
Click Choose File and browse for your logo. The logo must be an image file.
Run - Run the report to preview.
Save - Enter name, a description (optional), decide upon the options and permissions.
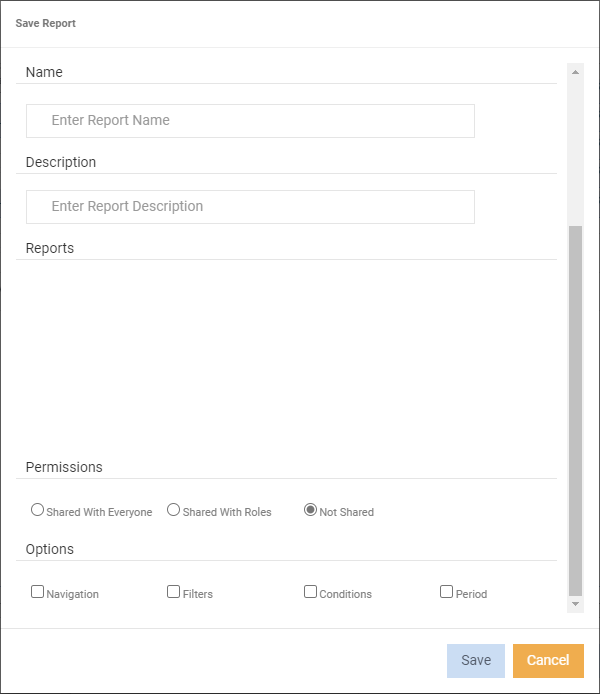
On save, the report will be saved under reports in the navigation tree.