Data Browser / Configure
Data Browser
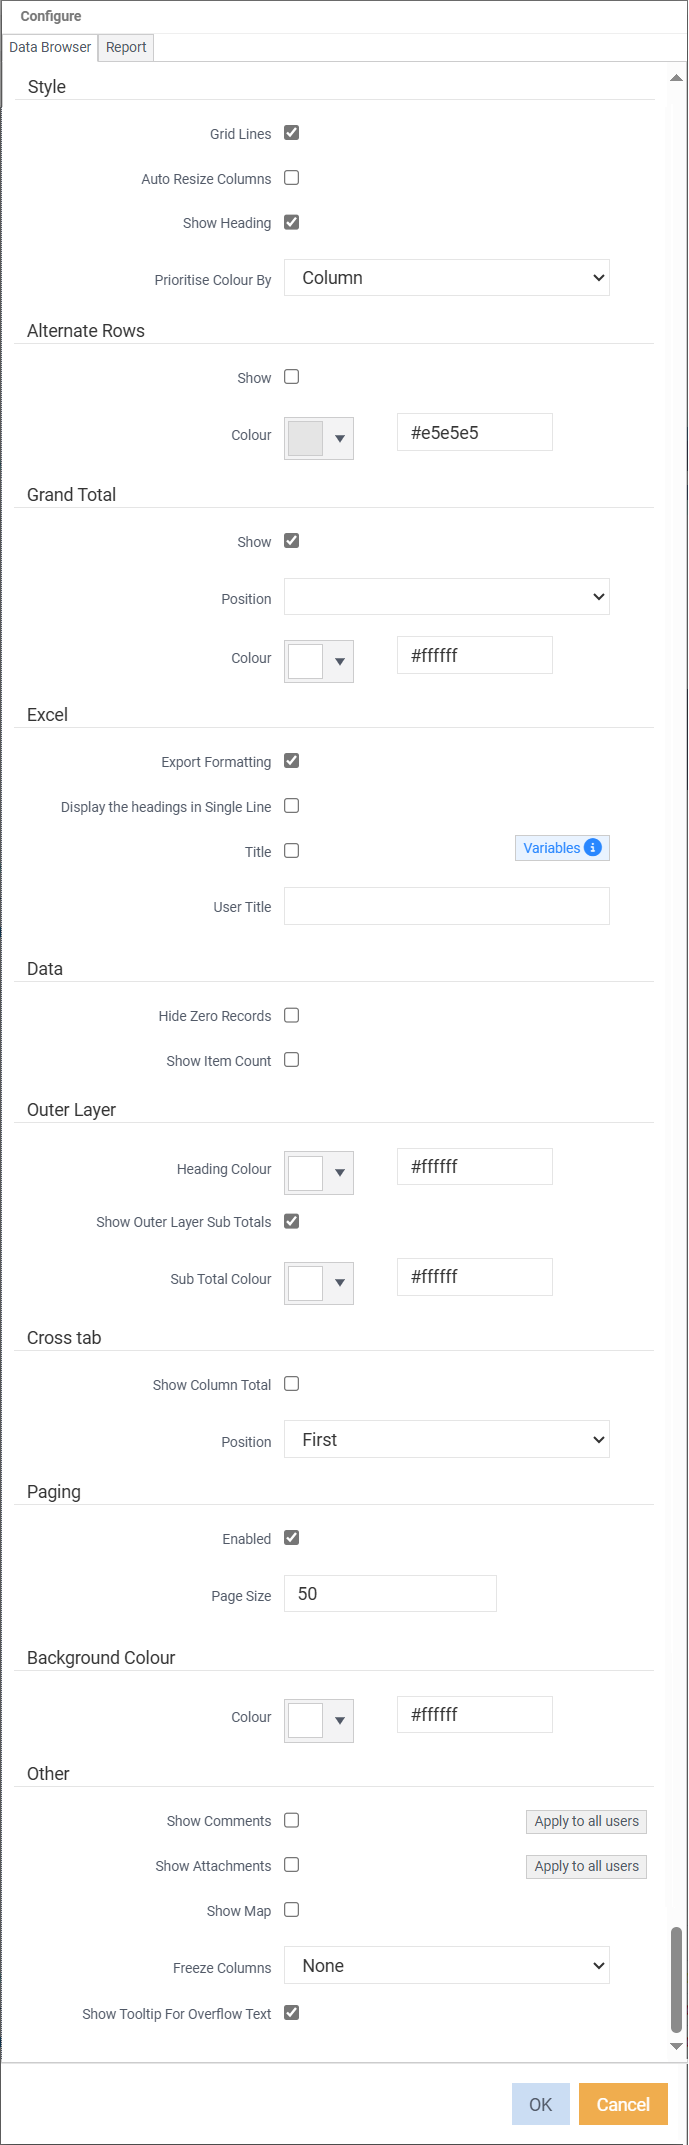
Style
Grid Lines - ticking displays your data in a grid format of various options and Report displays your data without column or row grids.
Auto resize columns - have the columns or resized as you drill through the layers.
Show Heading - display the header/name at the top of the window.
Prioritise Colour By - choose which colour will take priority when 'row' colour and 'column' colours are being used.
Alternate Rows
Show - tick to display each alternate row in a different colour.
Colour - select which colour for the alternate row.
Grand Total
Show - ticked by default. Not only does it show the total of columns, but it provides a way to navigate back in the data browser.
Position - choose whether you want the grand total to be at the top or bottom of the data browser.
Colour - select the colour for the grand total row.
Excel
Export Formatting - ticked by default. When exporting data to excel the formatting will remain, except for quick export.
Display the headings in Single Line. Headings display in a single line once exported.
Title. Tick to signify that the values in 'user title' will be used instead of the system name and details
User Title. Free text field for the report name. Clicking variables will allow that variable to show. Variables button - displays a modal window which will allow the user to choose
Data
Hide Zero Records - hide any rows that have zeros in every column on the Data Browser window.
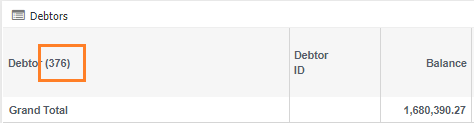
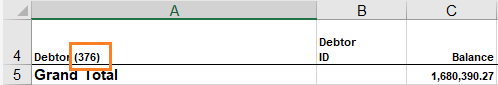
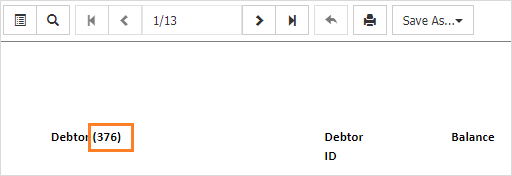
Show Item Count - show the number of rows per layer available.
When exporting to excel, it displays as
Or, if exporting as a report, it displays as
Outer Layer
Alternate row colour settings for outer layer reports.
Heading Colour – specify what colour you would like your headings to be.
Show Outer Layer Sub Totals – untick if you do not want to display sub totals.
Sub Total Colour – specify what colour you would like your sub totals to be.
Cross Tab
Show Column Total - tick to display column total.
Position - Select where the position of the total displays.
Paging
Enabled - turned on by default, to assist with load times of large amounts of data.
Page Size - Number of rows per page. Set at 50 by default.
Background Colour
Colour - select a colour for the background.
Highlight Colour Highlight Selected Row tick to highlight the selected row.
Highlight Selected Column tick to highlight the selected column.
Colour select the highlighting colour.
Other
Show Comments - display comments that have been attached to layers.
Show Attachments - display attachments that have been attached to layers.
Show Map -
Freeze First Column - like Excel, freeze the first column
Show Tooltip for Overflow Text - hovering over a description will display a tool tip, if the column width is small. Ticked by default when adding a new widget or running a report.
Report
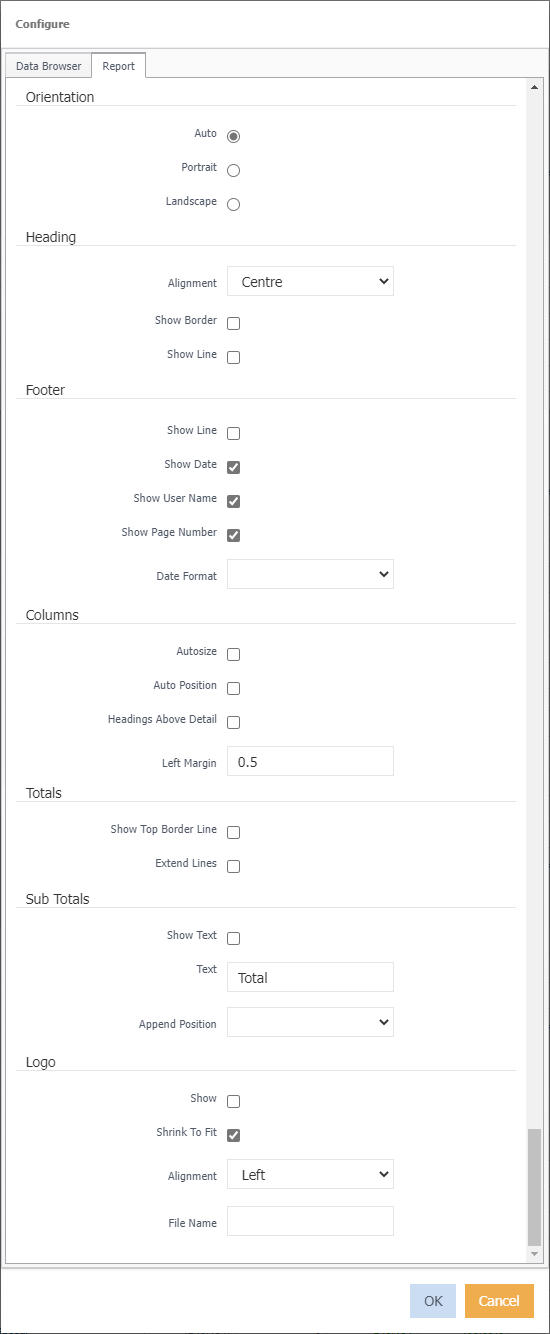
Refer to report editor settings for further information.