System / Alerts
Alerts are indicators to show whether particular items in your Dataset(s) need attention.
Alerts use a SQL query, which could be querying the Budgets or another database.
The following are examples of Alerts that you could have set up:
- Cost Centres that are over a certain percentage of their budget.
- Employees with more than a certain amount of weeks of annual leave.
- Users that are currently logged into the system.
- When a user last logged into the system.
- When Overtime goes over a certain amount.
Create Alert
-
Click

The below popup will display
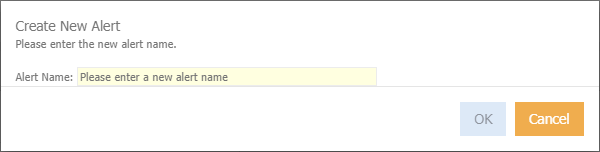
-
Enter a name for the alert
-
Click Ok
The below will display
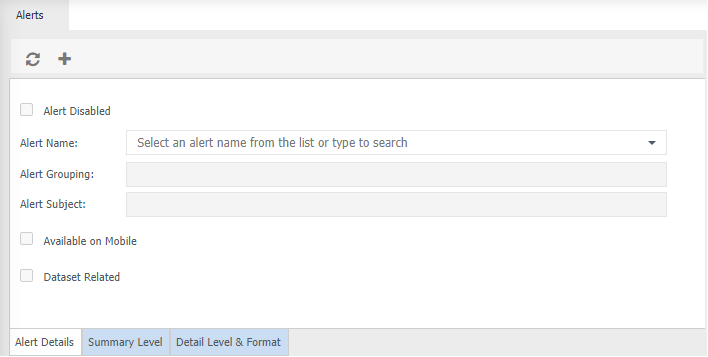
Alert Disabled - tick this option if you do not want to delete the Alert and rather disable it.
Alert Name - Displays the newly created alert name.
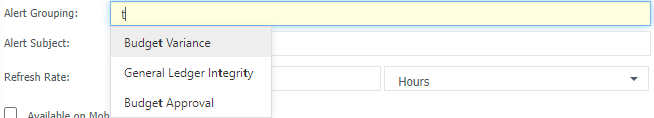
Alert Grouping - Enter a new name, start typing a name and a list of groupings will display. Enables Alerts to be grouped together. For example
Alert Subject - start typing a name and list of subject will display. Enables alerts with the subject name to be grouped together. For example
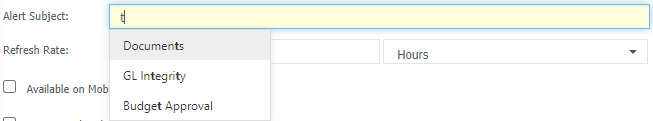
Refresh Rate - from the drop down menu select how often you wish the Alert to be updated, which is from 1 - 60 seconds, minutes or hours.
Available on Mobile - tick if the alert is to display in mobile app.
Dataset Related - tick if the Alert relates to a specific dataset. The below will display.
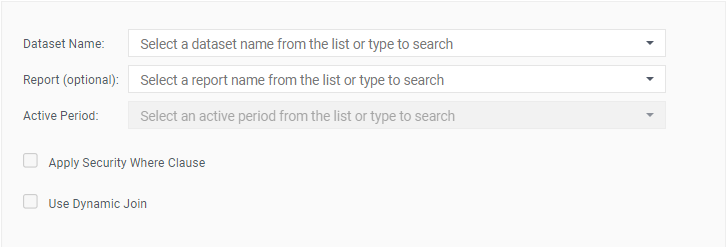
Dataset Name - select the relevant dataset.
Report (optional) - select a report to display as the alert data. If no report is selected the alert data will be obtained using the SQL statements
Active Period - select the relevant Time Series that the Alert applies to.
Apply Security Where Clause - tick this if you want Users security to be applied to the Alert. That is, if the Users have restricted access then they will only see the Alert applied to their access levels.
Use Dynamic Join - becomes visible when Apply Security Where Clause is ticked. Tick if powerdata is used in dataset connection.
-
Choose Summary Level tab for entering SQL and altering hyperlink.
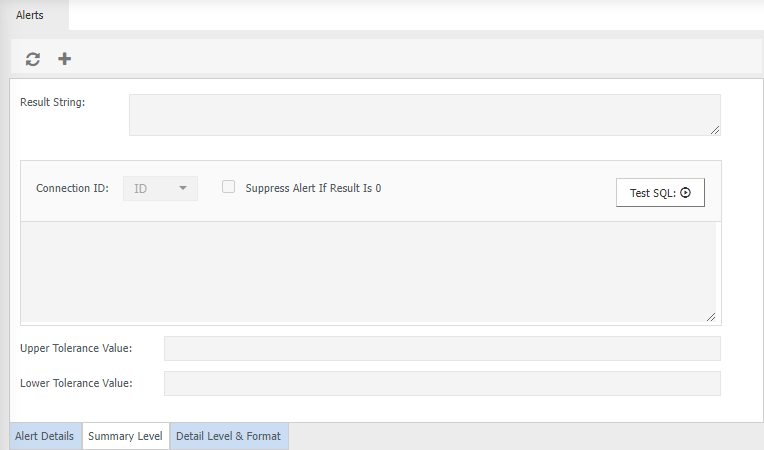
Result String - enter the description that will appear for the Alert in the Alert window.
Connection ID - from the drop down menu select the connection ID that is pointing to the database where the SQL query will be run from.
Suppress Alert if Result is 0 -
-
Enter the SQL query into white space which will be run from the database that the Connection ID is pointing to. You can use variables e.g. {@ActivePeriod}, {@UseComputerDate}.
-
Click Test SQL Statement to ensure that it is correct.
Upper Tolerance Value - if the result of the Alert is numeric then you can enter a value that will change
 to green indicating a favourable result.
Lower Tolerance Value - if the result of the Alert is numeric then you can enter a value that will change
red indicating an unfavourable result. -
Choose Detail Level & Format tab for populating SQL details.
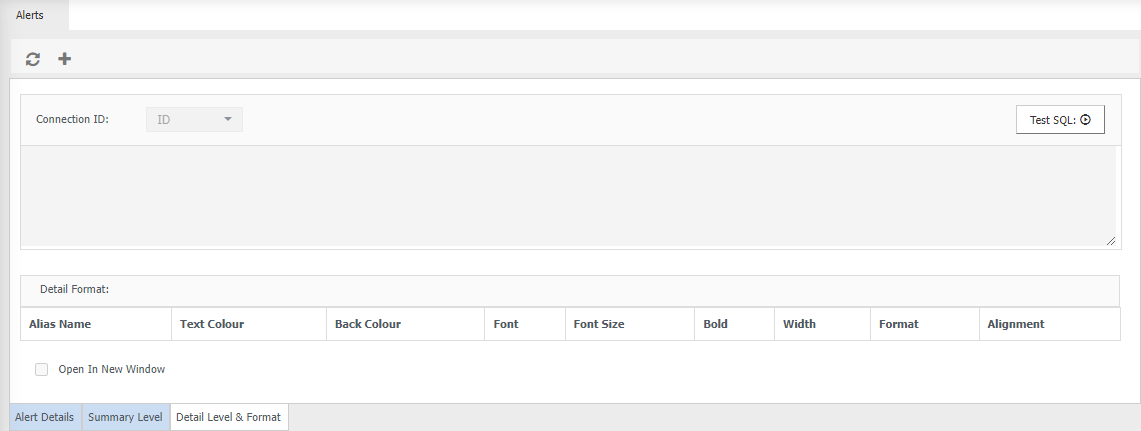
Connection ID - from the drop down menu select the connection ID that is pointing to the database where the SQL query will be run from to provide detail information about the Alert.
-
Enter the SQL query into white space which will be run from the database that the Connection ID is pointing to.
-
Click Test SQL Statement to ensure that it is correct.
Details Format - this is where you can change the format of the columns that appear in the Alert, such as text and background colour, font style and size etc.
Open in Window - tick this option if you wish to open the details of the Alert in a separate window.
-
Click
 to save.
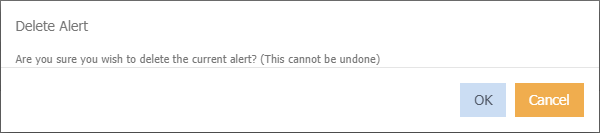
Delete Alert
- Select the alert from the Alert Name field
- Click

-
Click Ok on the below message